
How to Analyze Historic Sales Velocity to Find Your Highest-Value Persona
When you ask an early-stage founder who their ideal customer is, they will almost always describe their favorite customer. They will tell you about the big brand that signed a contract six months ago, or the high-profile tech startup that left a glowing review on G2. It is completely natural to look at these milestone wins and assume they represent the future blueprint of your entire sales organization.
But if you build your outbound sales strategy based on your favorite memories, you are taking a massive financial risk with your startup's runway capital.
The truth is that early-stage B2B sales data is filled with statistical anomalies. Founders close weird deals all the time through personal networks, previous relationships, or sheer, unrepeatable persistence. If you take those random wins, label them as your Ideal Customer Profile (ICP), and hand them to an incoming sales team to copy, your pipeline will likely stall.
To build a truly predictable revenue engine, you have to strip the emotion out of your historical data. You need to stop looking at contract value in isolation and start measuring Pipeline Velocity.
Pipeline velocity is the ultimate truth-teller in B2B sales. It doesn’t care about how impressive a customer's logo looks on your website or how friendly the champion was during the discovery call. It simply calculates how much revenue a specific segment generates for every single day they sit in your sales funnel.
Here is the step-by-step framework to analyze your historical velocity and find your true, highest-value buyer personas.
Step 1: Isolate and Segment into Tight Cohorts
Before you can run any calculations, you have to break your CRM data out of its massive, unorganized list. Export your entire deals history—including both your closed-won contracts and your closed-lost opportunities—from the past 12 to 24 months.
Now, instead of sorting them by revenue alone, group these accounts into hyper-specific buckets based on shared operational DNA. Look closely at three specific dimensions:
Firmographics: Move past broad labels like "SaaS" or "Healthcare." Segment them by exact employee thresholds, funding stages, or geographic operating regions.
The Technical Footprint: What is their existing technology stack? Do they use legacy on-premise systems, or are they cloud-native?
The Persona Attributes: Who was the actual economic buyer who signed off on the budget? Was it a VP of Engineering, a Chief Security Officer, or a Head of Operations?
By the time you finish this sorting process, you should have clear, distinct cohorts. For example, instead of a generic "Enterprise tech" bucket, you will have a highly defined cohort like: "US-based B2B logistics platforms, between 100-500 employees, running on HubSpot, with a Head of Operations as the main decision-maker."
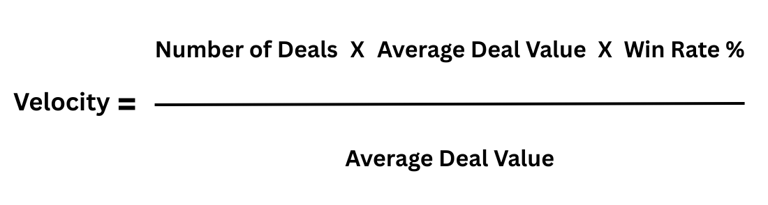
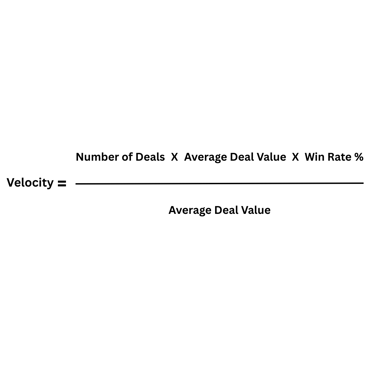
Step 2: Apply the Pipeline Velocity Equation
Once your historical deals are cleanly sorted into these cohorts, you need to measure how each group actually performed using a strict mathematical framework. For every single cohort, calculate their performance using the pipeline velocity formula:
Let’s break down exactly how this math exposes the hidden leaks in your sales strategy. Imagine you are comparing two distinct customer cohorts that you currently treat with equal priority in your outbound sequences:
Cohort A: The Marquee Enterprise Target
Average Deal Value: ₹25,00,000
Win Rate: 10%
Sales Cycle Length: 300 days
The Math: (1x25,000x0.10)/300 = ₹833 per day
Cohort B: The Mid-Market Operator
Average Deal Value: ₹7,50,000
Win Rate: 35%
Sales Cycle Length: 45 days
The Math: (1x7,50,000x0.35)/45 = ₹5,833 per day
When you look at this data through a purely emotional lens, Cohort A looks like the obvious winner. It delivers a massive contract value that looks fantastic in a board meeting. But when you apply the velocity equation, the truth comes out: Cohort B generates over seven times more revenue per day inside your sales funnel than Cohort A. Cohort B represents your path of least resistance. They make decisions quickly, navigate internal procurement with minimal friction, and close fast. Cohort A, despite the big numbers, is an expensive operational drag that consumes months of your team's focus and keeps your capital tied up in an unpredictable pipeline.
Step 3: Align Your Outbound Resources with the Math
The final step is translating these mathematical insights into an actionable operational playbook for your team. Take a hard look at the cohorts that achieved the highest daily velocity scores and declare them your primary validated target market.
This data gives your sales development reps an undeniable roadmap. They no longer have to waste their mornings debating which accounts to target on LinkedIn or guessing how to frame a pitch. You can now build outbound sequences that target the exact firmographic attributes, tech stacks, and buyer titles that are mathematically proven to move through your system with the absolute lowest amount of friction.
📌 Next Step in the Architecture
Now that you know how to mathematically calculate your highest-velocity customer cohorts, how do you make sure your CRM automatically prioritizes these leads the moment they hit your database?
Read the technology breakdown: Intent vs. Fit: How to Categorize Leads into "Sales Now" and "Suppress"
Your Sales Growth Partner
Contact US
Subscribe
sales@salesnair.com
© 2026. All rights reserved.
GroRev SalesNair
GroRev SalesNair LLP
B6-701, KLJ Greens,
Sector -77, Faridabad
Haryana -121004


Accepted payment Methods
GSTIN: 06ABBFG6113A1Z5
LLP Identification Number: ACI-7240
Policies